Tearsheet HTML#
Note
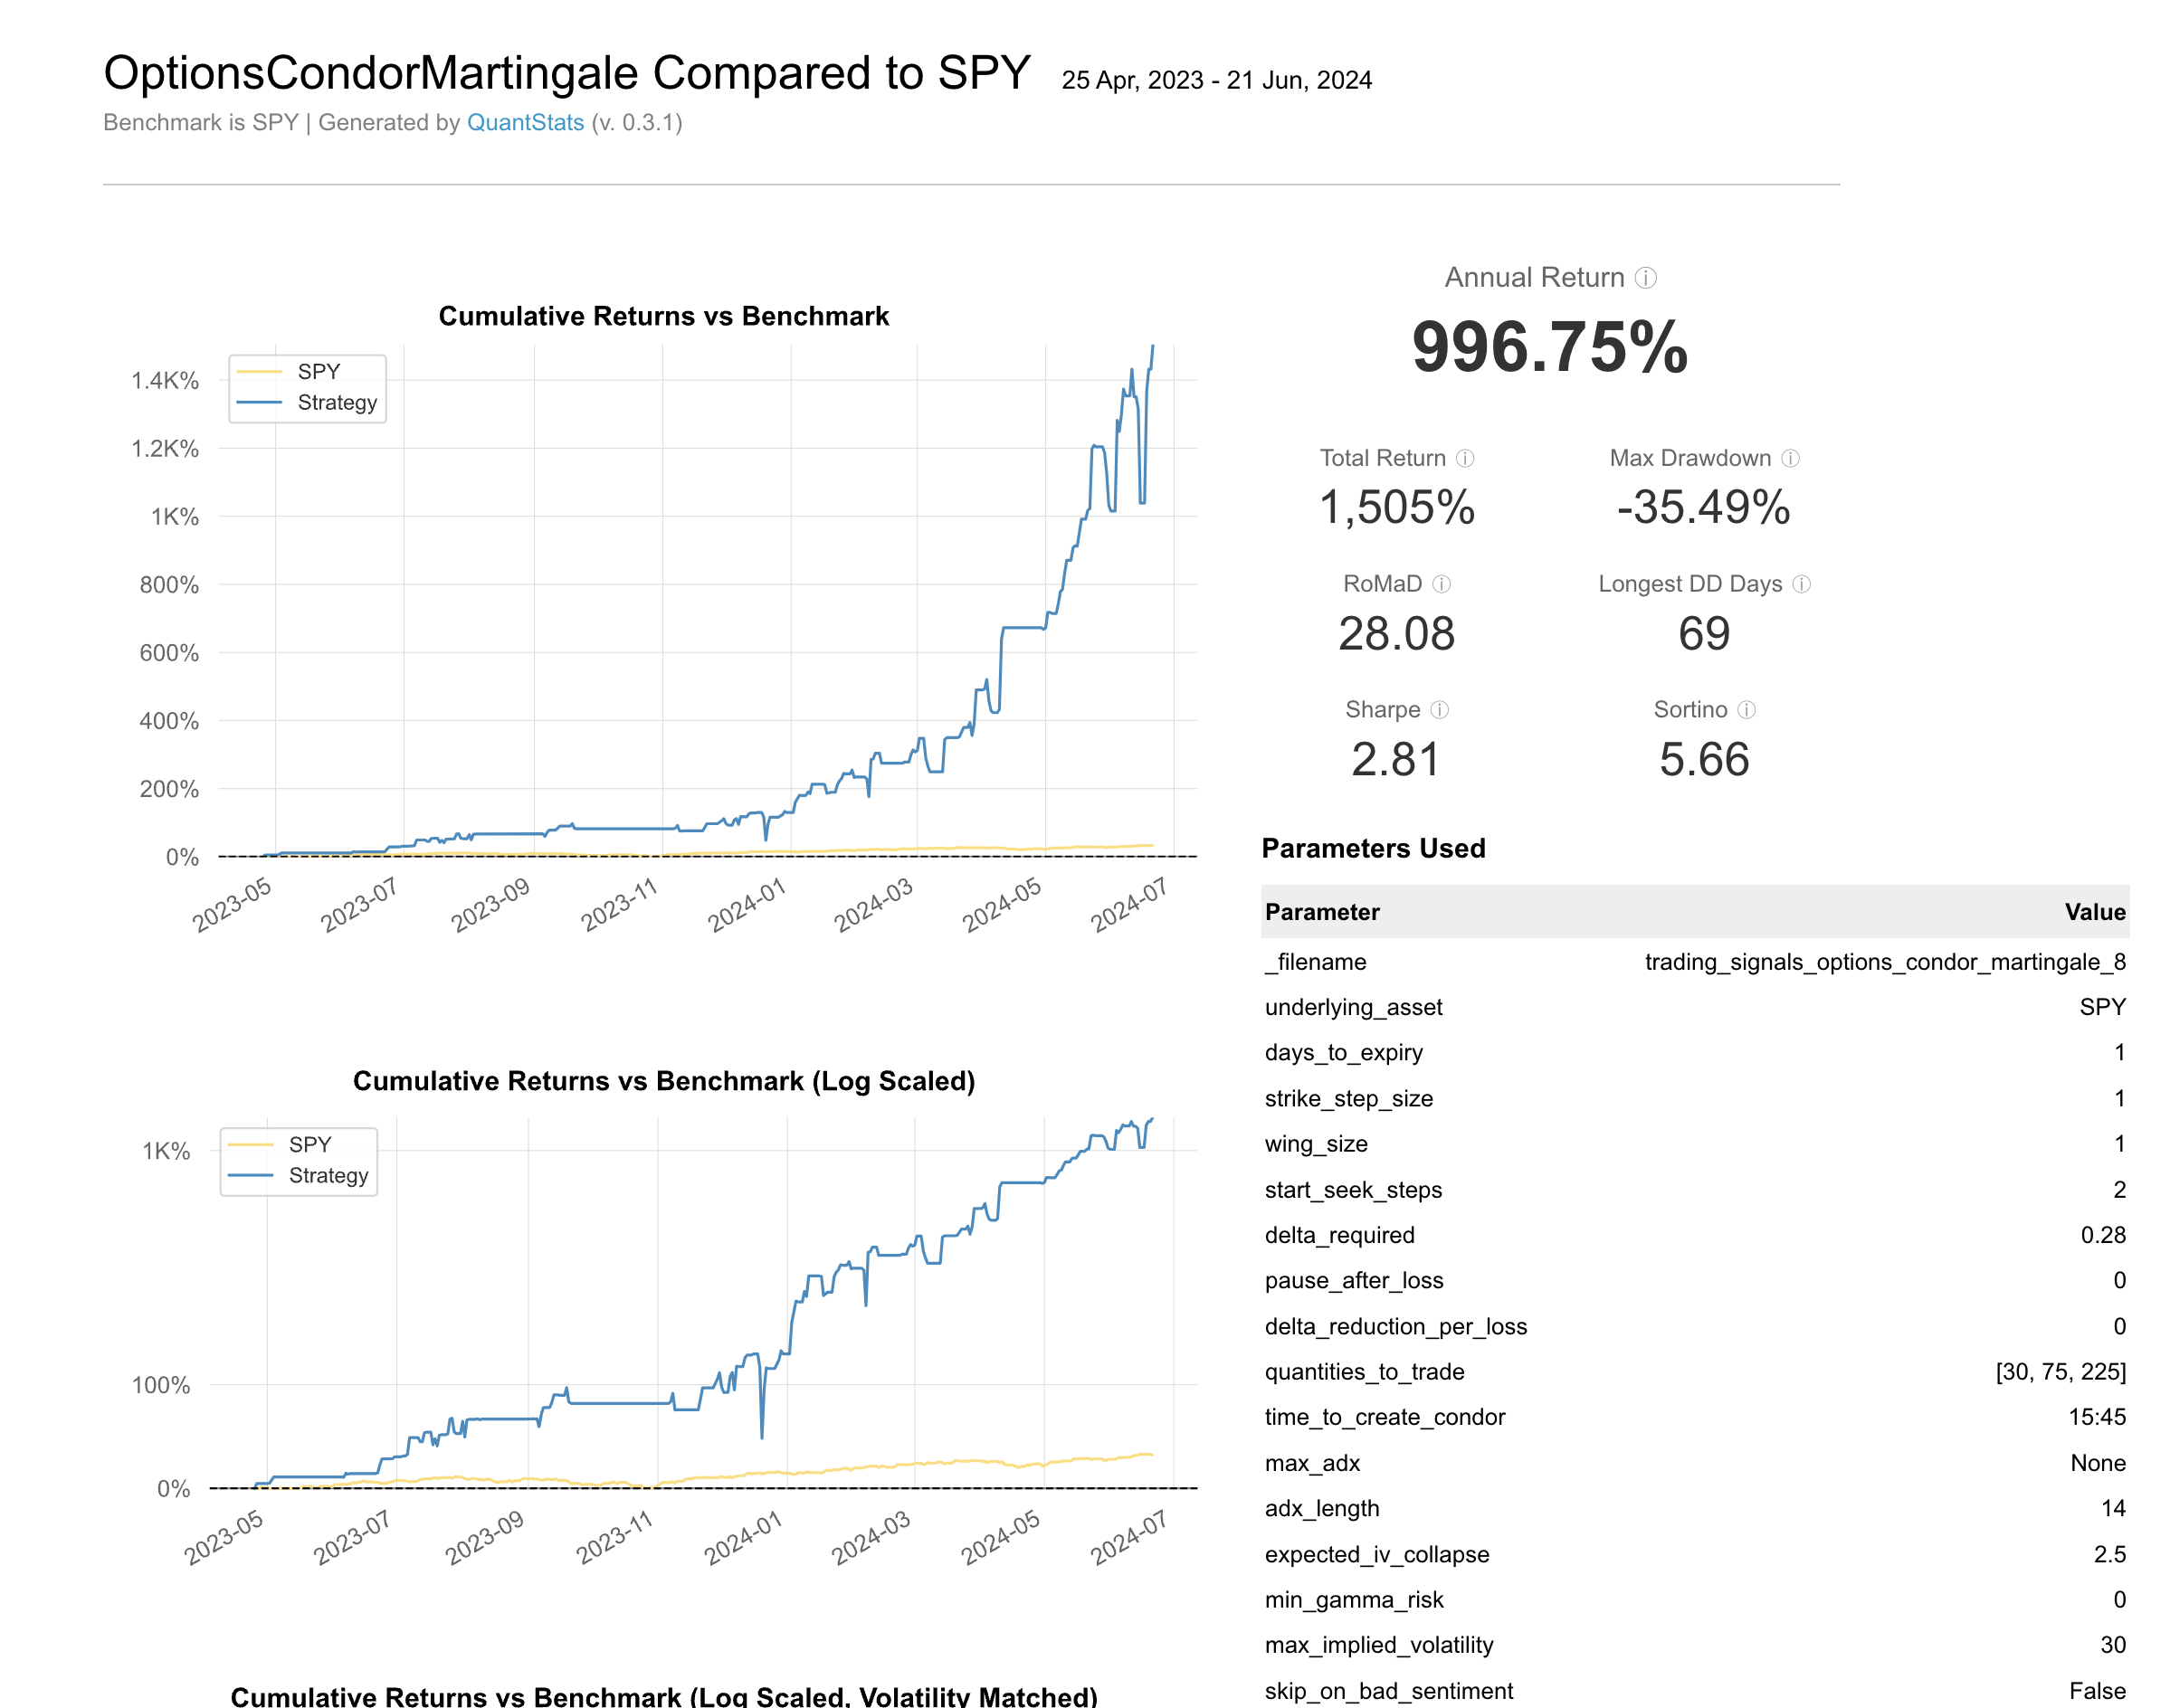
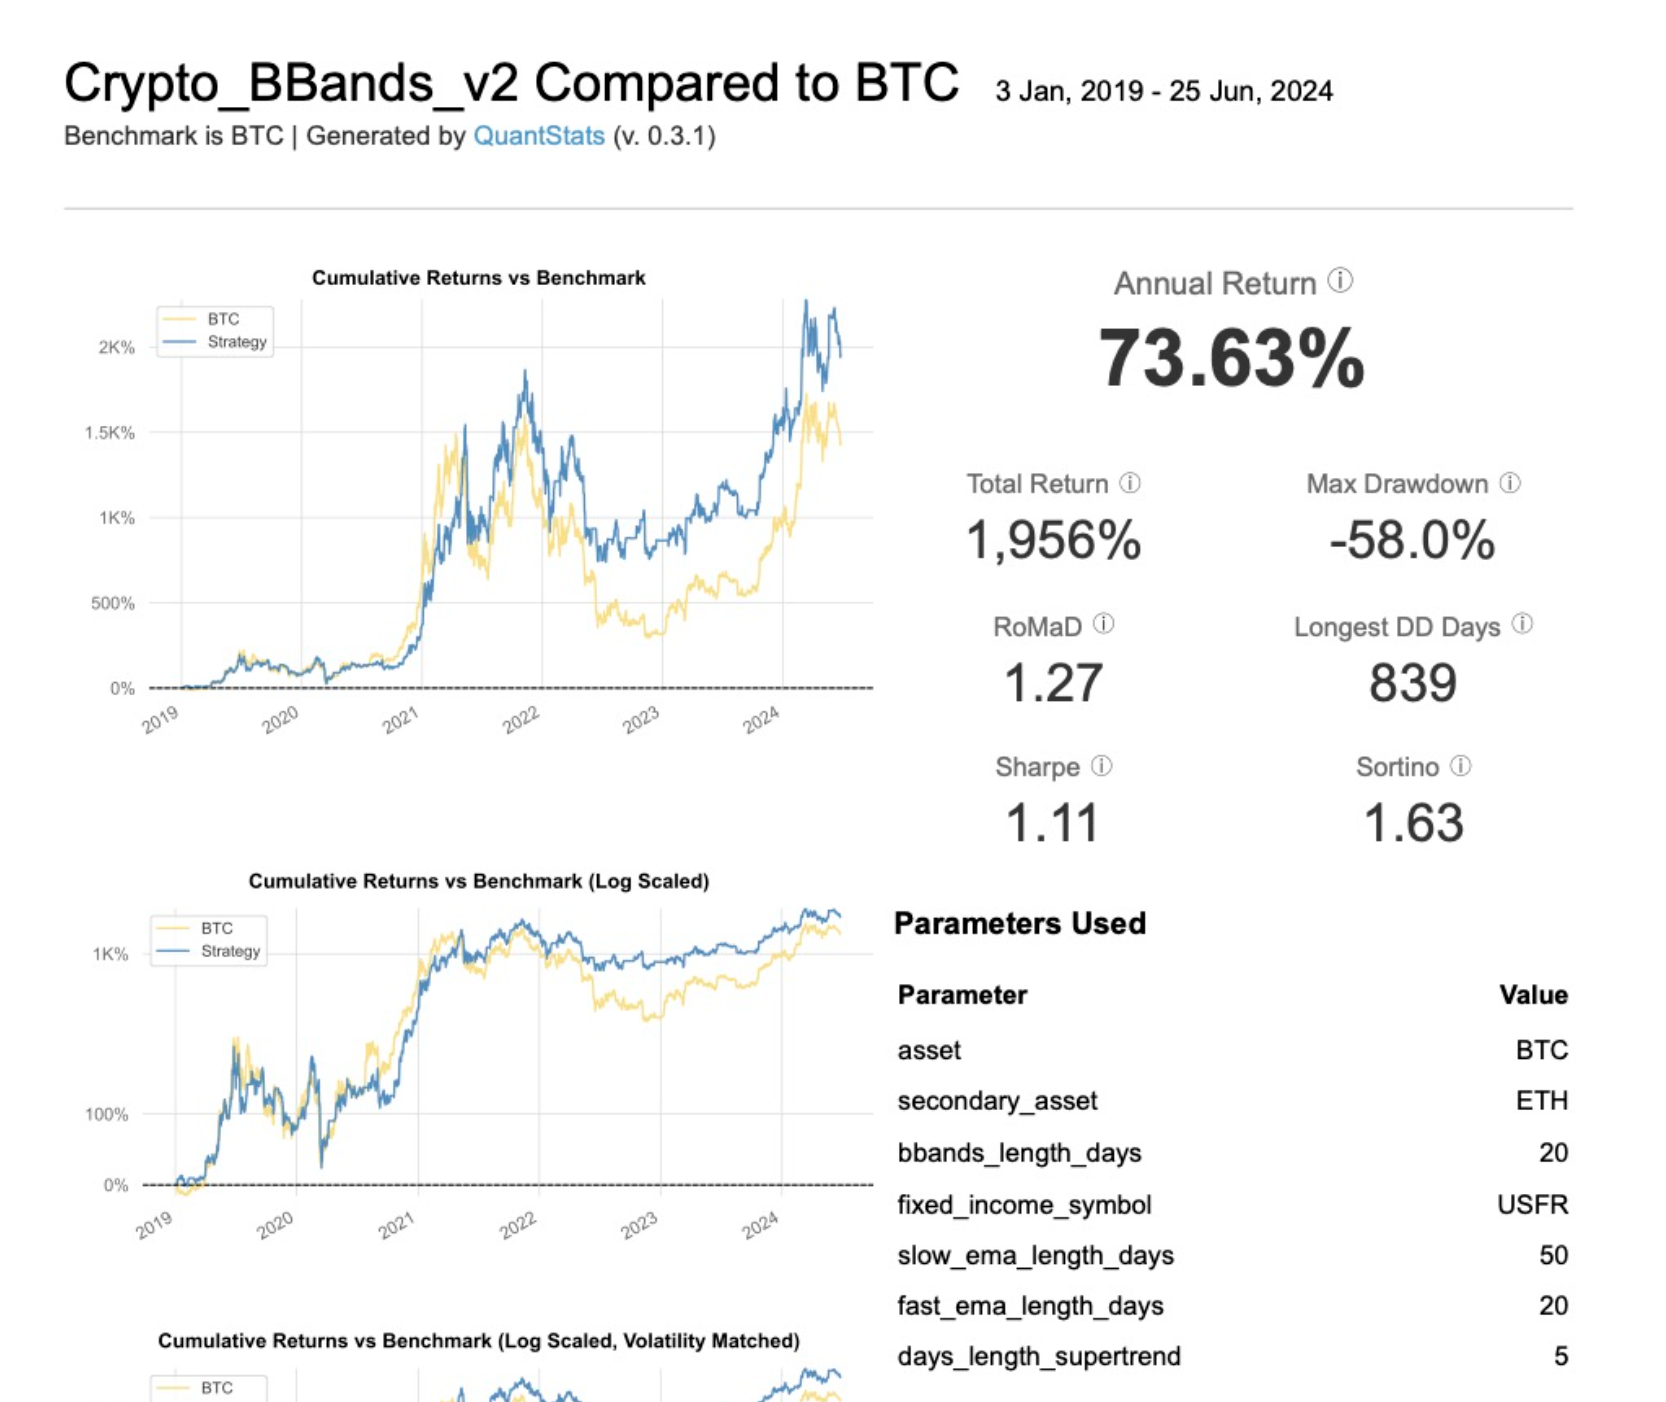
The Tearsheet HTML is one of the most important files generated and is created using the quantstats-lumi library. It includes a variety of metrics such as:
Average Annual Return: The yearly return of the strategy.
Total Return: The overall return from the start to the end of the backtest period.
Sharpe Ratio: A measure of risk-adjusted return.
RoMaD (Return over Maximum Drawdown): A ratio that compares return to the maximum drawdown.
Sortino Ratio: A variation of the Sharpe ratio that differentiates harmful volatility from total overall volatility.
Max Drawdown: The maximum observed loss from a peak to a trough of a portfolio, before a new peak is attained.
Longest Drawdown Duration: The longest period during which the portfolio has not reached a new peak.
These metrics are accompanied by various graphs such as:
Cumulative Returns vs Benchmark: Shows the strategy’s cumulative returns compared to a benchmark.
Cumulative Returns (Log Scaled): A log-scaled version of cumulative returns for better visualization of exponential growth.
Important
These tearsheets showcase different strategies we offer. Each strategy is tailored to achieve specific goals:
Condor Martingale Strategy: Creates an Iron Condor with a defined delta, adjusting quantities based on previous performance. It uses a 1 DTE Iron Condor expiring daily.
Crypto BBands v2 Strategy: Uses Bollinger Bands and exponential moving averages to determine buy and sell points.
Interested in implementing these strategies? Visit our website at Lumiwealth to access the code and start optimizing your investments. For any questions, email us at support@lumiwealth.com.